Canadian Equity Value –
In the current challenging economic environment with both equity and fixed income markets in decline, Canada has been noted as a likely outperformer in several sell-side research papers.[1] In addition, Canadian equity value style has outperformed the S&P/TSX Index by a large margin over the last couple of years, as well as delivering longer-term added value. This quarterly update shares the latest performance of the Scheer Rowlett Canadian equity strategy, highlights how the team has consistently maintained its relative value style, as well as why the sell-side research is bullish on Canada.
Performance to September 30, 2022
Annualized Returns (CDN) – September 30, 2022
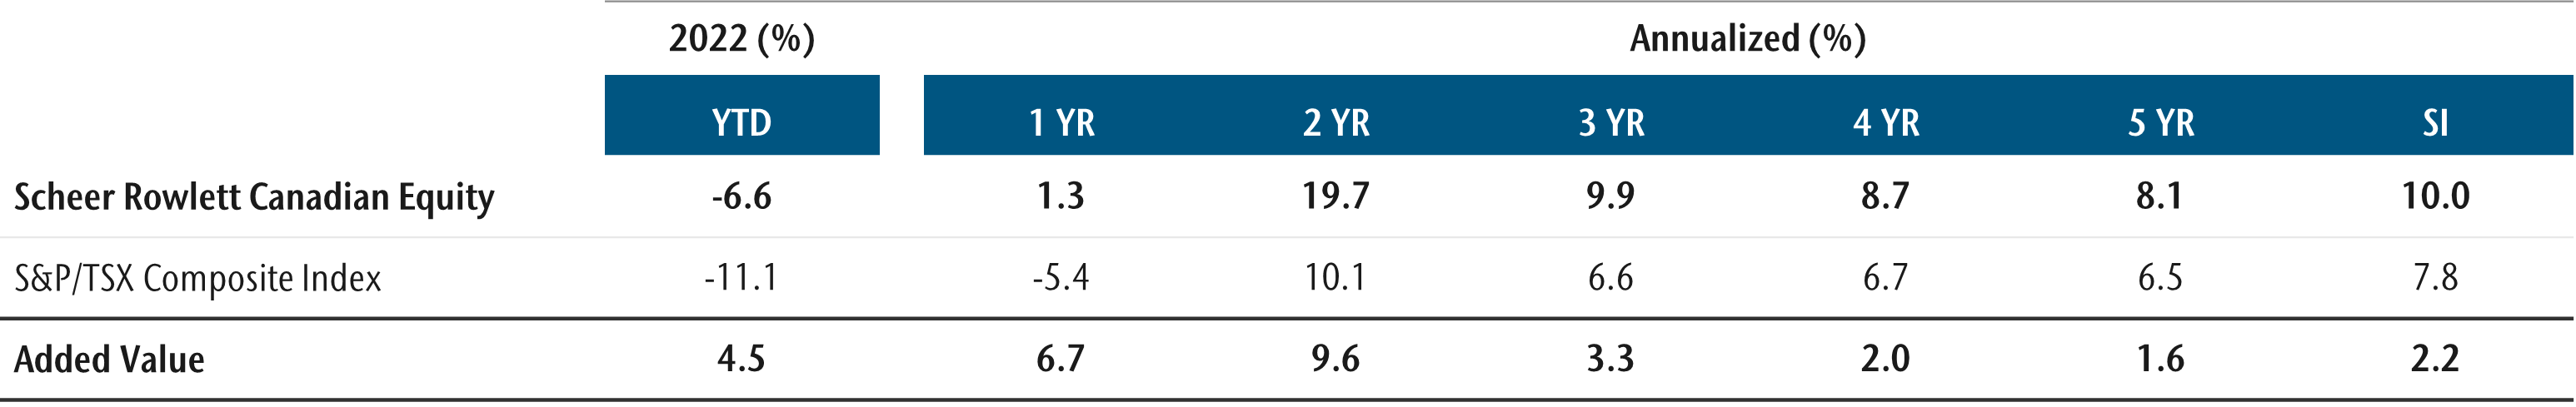
Inception Date: December 31, 1995
All returns are gross of fees except where noted. Added value may differ due to rounding to 1 decimal place.
Annual Returns (CDN)
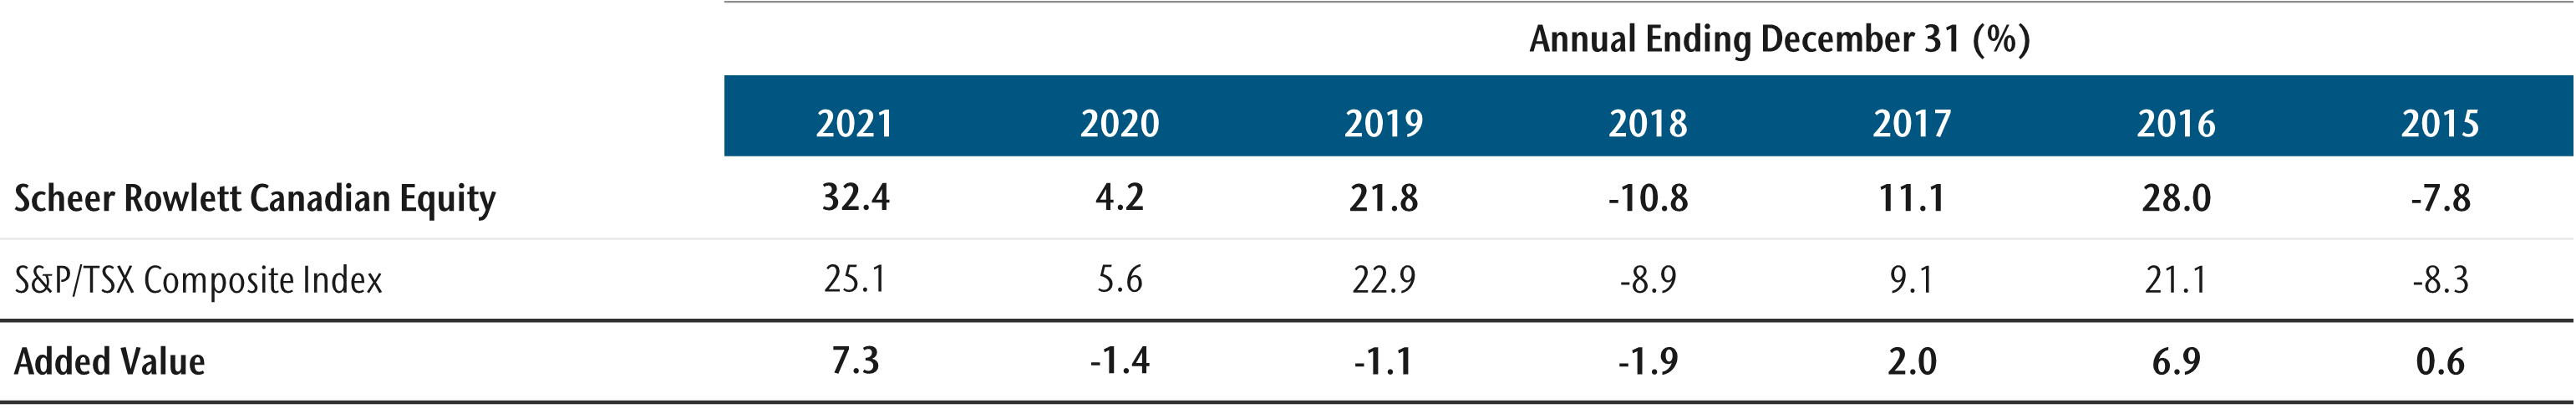
Gross performance figures are stated after trading fees and before management fees, performance fees and operating expenses. Operating expenses include items such as custodial fees for segregated accounts and for pooled vehicles would include charges for valuation, audit, tax and legal expenses. Such additional operating expenses would reduce the actual returns experienced by investors in segregated accounts and pooled vehicles.
Consistent Style
Scheer Rowlett focus is on the long-term earning potential in determining a company’s true value. Our belief is that ultimately earnings matter. We do not try to outguess others in timing market turns or what the market may favour next. These beliefs have guided our investment process for over 27 years. A consistent and disciplined process has resulted in portfolios that display “value” characteristics with aggregate price-to-earnings (P/E) and price-to-book (P/B) multiples below those of the overall stock market.
Price/Earnings (x)
Source: Connor, Clark & Lunn Financial Group
Price/Book Value (X)
Source: Connor, Clark & Lunn Financial Group
The concentration of the Canadian equity market has at times resulted in a small number of securities aggregating to a disproportionate share of the market index. For example, at the end of September 2022, the largest 15 securities represented 47% of the S&P/TSX Index.
The top 15 security list has also witnessed the rise and fall of several companies over the last dozen years including Potash Corp, Blackberry and Valeant, to name a few. The most recent case in point being Shopify, which became the largest company in the index (approaching ~7% in November 2021) before its subsequent material decline to 1.7% of the index at the end of September 2022.
A value style can be contrarian to general market consensus when unreasonable expectations get built into valuations leading to periods of underperformance. However, when reality reasserts itself and companies like a Shopify correct, adherence to a disciplined value approach can provide valuable protection.
Oh Canada!
In the current economic environment, sell-side research has recognized the attraction of the Canadian equity market. In June 2021, Bank of America research predicted that Canada would perform well relative to other markets amid rising commodity prices. In its latest April 2022 research paper, they believe the tailwind is even stronger now for Canada and remain bullish on the S&P/TSX Index, including a belief that the valuation metrics are attractive, particularly relative to the U.S equity, S&P 500 Index.
The Case for Canadian Equity Value
In the current challenging economic environment, Canada offers exposure to attractive commodity and resource sectors along with competitive valuations compared to other markets globally. A natural hedge to inflation and poised to benefit from global decarbonizing efforts, the Canadian market is uniquely positioned for the current environment. A relative value style can capture this potential while avoiding the pitfalls that come from the marketplace’s propensity to chase market winners at any price.
[1] Bank of America, A new regime: Buy Canada, 22 April 2022 and Scotiabank, Here’s Why You Want to Buy Canada, March 22, 2021.
1. Unless otherwise stated, all data is as at September 30, 2022 and stated in Canadian dollars (CDN$). Annual performance figures are as at December 31 for each calendar year. Source: Connor, Clark & Lunn Financial Group Ltd., Morningstar Canada and Thomson Reuters Datastream. 2. Performance history for the Scheer Rowlett Canadian Equity Strategy is that of the Scheer Rowlett Canadian Equity Composite. The Composite has a creation and inception date of January 1996. All performance data is gross of fees unless otherwise stated. Gross performance figures are stated after trading expenses and before management fees, performance fees and operating expenses. Operating expenses include items such as custodial fees for segregated accounts and for pooled vehicles would also include charges for valuation, audit, tax and legal expenses. Such additional operating expenses would reduce the actual returns experienced by investors in segregated accounts and pooled vehicles. Past performance of the strategy is no guarantee of the strategy’s performance, future returns are not guaranteed, and a loss of capital may occur. 3. Benchmark for the Scheer Rowlett Canadian Equity Strategy is the S&P/TSX Composite Index. Benchmarks and financial indices are shown for illustrative purposes only, are not available for direct investment, are unmanaged, assume reinvestment of income, do not reflect the impact of any management or incentive fees and have limitations when used for comparison or other purposes because they may have different volatility or other material characteristics (such as number and types of instruments) than the strategy. The strategy’s investments are not restricted to the instruments comprising any one index and do not in all cases correspond to the investments reflected in such indices. 4. Added value figures may differ due to rounding to 1 decimal place.
These materials (“Presentation”) are furnished by Scheer Rowlett & Associates Inc. (“Scheer Rowlett”) on a confidential basis for informational and illustration purposes only. This Presentation is intended for use by the recipient only and may not be reproduced or distributed to any other person, in whole or in part, without the prior written consent of Scheer Rowlett. Certain information contained in this Presentation is based on information obtained from third-party sources that Scheer Rowlett considers reliable.The information is as of the date indicated and reflects present intention only. This information is subject to change at any time, and Scheer Rowlett is under no obligation to provide you with any updates or amendments to this Presentation. This Presentation is not an offer to buy or sell, nor a solicitation of an offer to buy or sell any security or other financial instrument advised by Scheer Rowlett. This Presentation does not contain certain material information about the strategy, including important risk disclosures. An investment in the strategy is not suitable for all investors, and before making an investment in the strategy, you should consult with your professional advisor(s) to determine whether an investment in the strategy is suitable for you in light of your investment objectives and financial situation. Scheer Rowlett does not purport to be an advisor as to legal, taxation, accounting, financial or regulatory matters in any jurisdiction, and you should independently evaluate and judge the matters referred to in this Presentation.
For more information on the Scheer Rowlett
Canadian Equity Strategy please contact:

Jean-Philippe Lemay
Managing Director,
Head of Institutional Sales, Global
Tel: 1 (438) 944-9136
Email: [email protected]
For additional information on Scheer Rowlett & Associates Investment Management Ltd., please contact:
Jean-Philippe Lemay
Managing Director,
Head of Institutional Sales, Global

Please take the time to carefully read the following as it contains important information regarding certain restrictions imposed by statute and the applicable securities regulatory authorities on the distribution of information through this website.
Material presented on this website should be considered for background information only and should not be construed as investment or financial advice. Further, information on this website should not be construed as an offer or solicitation by the Connor, Clark & Lunn group of companies to provide investment management services or to buy or sell any products.
The Scheer Rowlett & Associates Investment Management Ltd. (Scheer Rowlett) website may contain hyperlinks to websites operated by parties other than Scheer Rowlett. Such hyperlinks are provided for your reference only. Scheer Rowlett does not control such websites and is not responsible for their contents. The inclusion by Scheer Rowlett of hyperlinks to other websites does not imply any approval or endorsement of the material on such websites or any association with their operators.
The Connor, Clark & Lunn group of companies includes a number of entities that may be registered as investment advisers, investment fund managers and exempt market dealers in various provinces and territories of Canada. A number of entities are also registered with the Unites States Securities and Exchange Commission as advisers in that country and the Connor, Clark & Lunn group of companies also includes a number of investment advisers and fund managers that are authorized and regulated by the Financial Conduct Authority in the United Kingdom. The information provided on this website regarding each entity is directed solely towards qualified investors in jurisdictions where the appropriate entity is registered. Services offered by any of the entities in the Connor, Clark & Lunn group of companies are offered solely to qualified residents of the jurisdictions where the entities are qualified to do business.
Certain securities regulations prohibit the publication of specific registration information about the registered entities in the Connor, Clark & Lunn group of companies. For more information, please contact the Connor, Clark & Lunn Compliance Department at [email protected] or 604-685-2020.